Description: Learn how to run a Sales Summary report on Business Intelligence (BI).
Sales Summary Report Guide
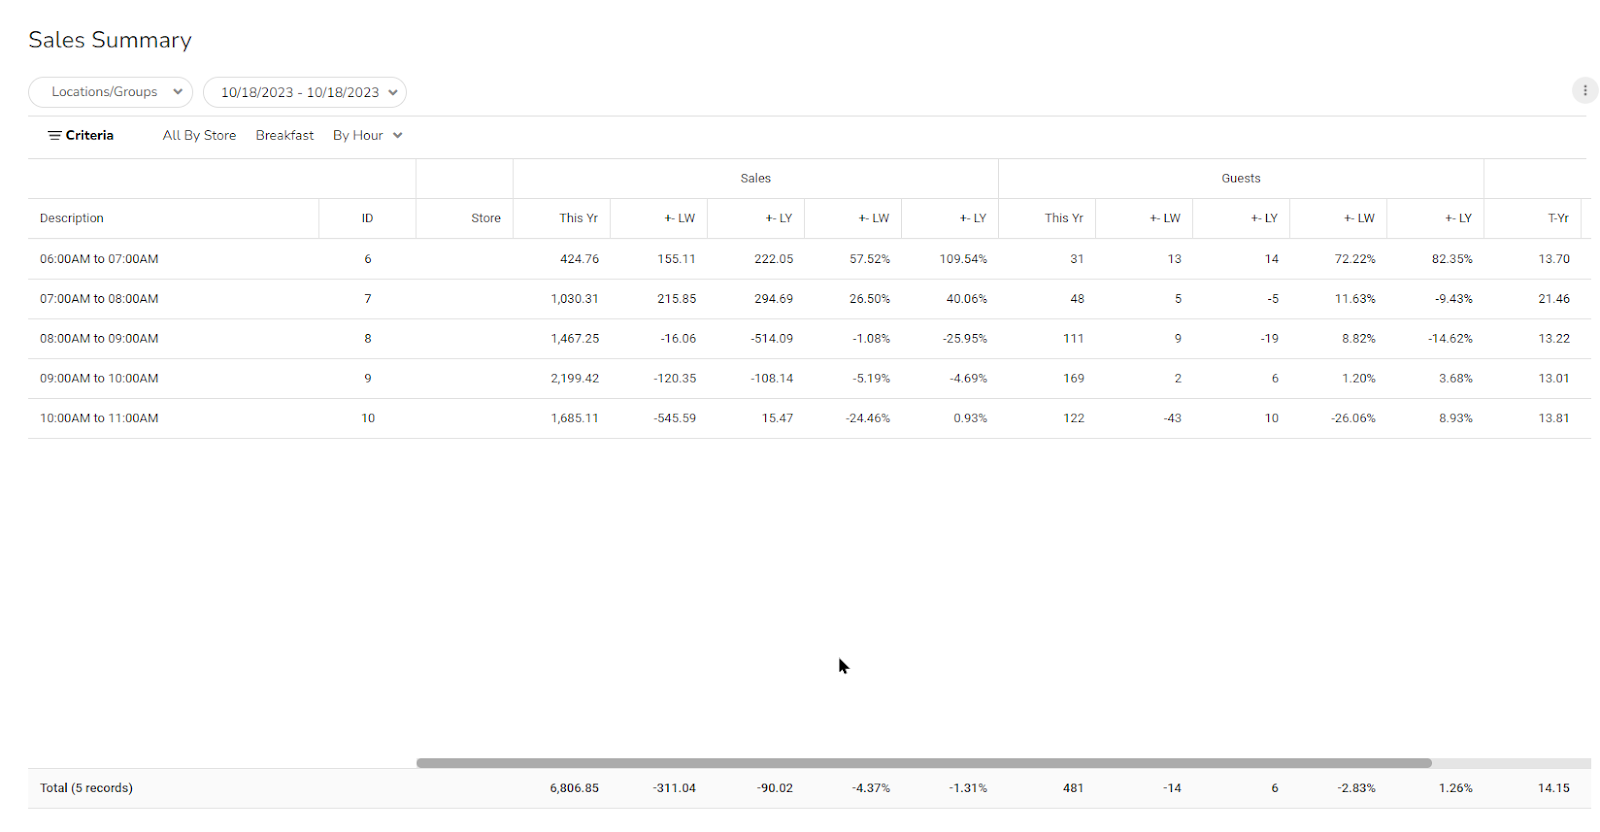
To access this report, log in to Business Intelligence and select Sales/Guests > Sales Summary.
Purpose of the Report
The Sales Summary Report allows you to compare sales performance by:
- Same Day Last Week (LW)
- Same Day Last Year (LY)
Important: Business Intelligence (BI) compares day-of-week to day-of-week. It does not compare calendar date to calendar date.
In addition to sales, you can compare:
- Guest counts / Transactions
- Sales per Guest
Using the Group By Feature
The Group By dropdown allows you to analyze sales data in multiple views, such as:
- Day Part
- Hour
- Store
- Other available groupings
This flexibility helps identify trends and performance shifts.
Identifying Sales Declines
If sales are down compared to Last Year, use this step-by-step approach:
- Check Guest Count / Transactions: If the guest count is down, traffic may be the issue rather than average spend.
- Drill Into Day Parts: Determine whether a specific day part (Breakfast, Lunch, Dinner, etc.) is underperforming.
- Drill Into Hours: If a particular day part is down, analyze hourly sales to identify specific time periods where business patterns may have shifted.
This layered drill-down approach helps pinpoint the root cause of declining sales.
Viewing Sales by Day (Monthly Overview)
Sales Summary also allows you to review daily sales performance over a longer time period.
To view last month’s daily sales:
- Change the Date Range to Last Month.
- Select Group By > Day.
This provides a day-by-day breakdown of sales for trend analysis and performance review.
When used effectively, the Sales Summary Report becomes one of the most powerful tools for diagnosing performance changes and identifying operational opportunities.
Comments
0 comments
Please sign in to leave a comment.